Sunday, October 17, 2010

Evaluation of Airborne Lidar Data to Predict Vegetation Presence/Absence

Article Citation: Monica Palaseanu-Lovejoy, Amar Nayegandhi, John Brock, Robert Woodman, C. Wayne Wright (2009) Evaluation of Airborne Lidar Data to Predict Vegetation Presence/Absence. Journal of Coastal Research: Fall 2009, Vol. , No. , pp. 83-97. 
http://www.jcronline.org.pinnacle.allenpress.com/doi/full/10.2112/SI53-010.1
One Line Summary

This study evaluates the capabilities of the Experimental Advanced Airborne Research LiDAR (EAARL) to predict the presence/absence of coastal vegetation communities in Barataria Preserve at Jean Lafitte National Park, Louisiana (JELA).
Short Summary
This study evaluates predictive vegetation models using LiDAR derived elevation (bare earth) and canopy height. Palaseany-Lovejoy et al.  compared two modeling methods, parametric and non-parametric. General linear models and generalized additive models using conventional methods are both evaluated for the study area.
This study aims to model and predict presence/absence of vegetation communities, and to assess the statistical significance of observed relationships with lidar metrics.  The objectives are to:
  1. model and predict presence/absence of coastal vegetation communities using EAARL lidar metrics as predictor variables in an area with small topographic variability.
  2. compare parametric and non-parametric methods of inference.
  3. assess modeling and prediction accuracies using conventional evaluation methods and two new indexes, net reclassification improvement (NRI) and integrated discrimination improvement (IDI). 
Reading Notes
Maps of vegetation communities and their spatial distribution are a primary tools in conservation, land management application, and decision support systems.
Several large scale efforts to map vegetation have used environmental gradients, in some cases combined with remote sensing data, to model and predict the presence/absence or percentage coverage of vegetation. (Bio, Alkemade, and Barendregt, 1998; Dobrowski et al., 2006; Frescino, Edwards, and Moisen, 2001; Moisen and Edwards, 1999; Moisen et al., 2006; Yee and Mitchell, 1991).
Relevant environmental gradients include elevation, slope, aspect, soil properties, water availability and subsurface depth, temperature, isolation, and latitude and longitude.
Remote sensing-based modeling and predictions are divided into two main groups: Parametric and non-parametric methods.
Parametric methods:  
Positives: Have the benefits of ease to use. Easy to interpret, straightforward statistical properties, and use explicit regression equations.
Negatives: Based on the assumption of normal distribution.
Non-parametric methods
Positives: Do not require normal distribution, and can accommodate different distributions. These are data driven methods rather then model driven methods.

Lidar EAARL Vegetation Metrics
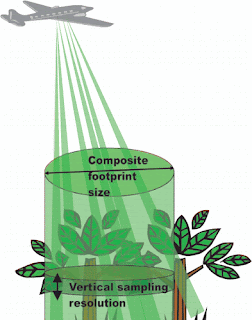

Definition of the EAARL Composite Footprint
The EAARL is a temporal waveform-resolving, green-wavelength (532 nm), small-footprint airborne lidar instrument.  The EAARL green-wavelength laser can map bathymetry (to a limit), topography, and vegetation simultaneously. Because this is a small footprint LiDAR system, it is able to map canopy heights of individual trees as opposed to forest segments.
Four distinct metrics are derived from the continuous EAARL waveforms: bare earth (BE), canopy height (CH), canopy reflection ratio (CRR), and the height of median energy (HOME).
All four EAARL lidar-derived metrics were calculated in this study: bare earth, canopy height, canopy reflection ratio, and height of median energy.
Bare Earth - Represents the last return value.
Canopy height - is the distance from the composite-footprint first-return to the ground.
Canopy reflection ratio - is the sum of the waveform returns reflected off the canopy divided by the sum of all returns.
Height of Median Energy -  is the median height of the entire composite waveform.

Evaluation Criteria
Models can be evaluated qualitatively or quantitatively in order to measure the degree of data fitting, or to assess the predictive power for real data or events (Myers, 1997).


Sensitivity is a measure of the proportion of true presence predicted by the model when the species actually occurred at that location and specificity is the proportion of absence predicted when true non-events or absence occurred (Cumming, 2000; Fielding and Bell, 1997).
Important Sources
Examples of generalized additive model (GAM) applications in modeling for plant ecology, mapping and prediction, forestry and ecological analyses have been presented by Austin (2002), Austin (2007), Austin et al. (2006), Frescino, Edwards, and Moisen (2001), Guisan, Edwards, and Hastie (2002), Leathwick, Elith, and Hastie (2006), Lehmann, Overton, and Leathwick (2002), Moisen et al. (2006), Wood and Augustin (2002), Yee and Mackenzie (2002), and Yee and Mitchell (1991).

Bio, A. M. F. , R. Alkemade , and A. Barendregt . 1998. Determining alternative models for vegetation response analysis: a non-parametric approach. Journal of Vegetation Science 9 (1):516
Dobrowski, S. Z. , J. A. Greenberg , C. M. Ramirez , and S. L. Ustin . 2006. Improving image derived vegetation maps with regression based distribution modeling. Ecological Modelling 192 (1–2):126142
Frescino, T. S. , T. C. Edwards Jr , and G. G. Moisen . 2001. Modeling spatially explicit forest structural attributes using generalized additive models. Journal of Vegetation Science 12 (1):1526.
Moisen, G. G. and T. C. Edwards Jr . 1999. Use of generalized linear models and digital data in forest inventory of northern Utah. Journal of Agricultural, Biological and Environmental Statistics 4 (4):372390
Moisen, G. G. , E. A. Freeman , J. A. Blackard , T. S. Frescino , N. E. Zimmermann , and T. C. Edwards Jr . 2006. Predicting tree species presence and basal area in Utah: a comparison of stochastic gradient boosting, generalized additive models, and tree-based methods. Ecological Modelling 199 (2):176187.
Myers, J. C. 1997. Geostatistical Error Management: Quantifying uncertainty for environmental sampling and mapping. New York Van Nostrand Reinhold. 571. p.  
Yee, T. W. and N. D. Mitchell . 1991. Generalized additive models in plant ecology. Journal of Vegetation Science 2 (5):587602
 
Enhanced by Zemanta

Monday, September 20, 2010

Spatial Autocorrelation: Trouble or New Paradigm?

Author(s): Pierre Legendre
Source: Ecology, Vol. 74, No. 6 (Sep., 1993), pp. 1659-1673
Published by: Ecological Society of America
Stable URL: http://www.jstor.org/stable/1939924

Legendre defines spatial autocorrelation as a property of random variable at a pair of locations that if are more similar then expected by random correlation,  are positively autocorrelated, and if less similar are negatively autocorrelated.  Spatial autocorrelation is general property of ecological variables.
Enhanced by Zemanta

Notes on Writing Papers and Theses - Ken Lertzman


Ken Lertzman
Bulletin of the Ecological Society of America, Vol. 76, No. 2 (Jun., 1995), pp. 86-90
Published by: Ecological Society of America
Stable URL: http://www.jstor.org/stable/20167913

Dr. Lertzman outlines common problems that he has found in scientific writing from his students. These problems give you insight into what someone who has reviewed many these, papers, and articles has found as common problems.  He offers 21 notes to keep in mind when writing.

1) Know your audience - You must adopt a style and level of writing appropriate for your audience.
  • Scientific writing is not "general purpose" and should not be tailored to be understood by everyone.
  • For class papers your audience is your professor.  I would extend it to the other people in your graduate seminar.
  • For Journals it will be the people who read the journal. (ie Geomorphology would be read by geomorphologists.)
2) Your professor is not there to teach you basic grammer and spelling.

Think about it, you want them to use your time together to make progress with you in your research. Use someone else to fix grammer and spelling.

3) Don't turn in your first draft

I was surprised that he even had this in here. However he did say one thing that stuck with me: "Good writing is rewriting."  So I understood this section is that you need to rework your writing over and over.  That is how excellent writing emerges.

4) Get and use style books

5) Avoid passive constructions when possible.

Avoid passive voice. It is unclear. It is better to use a personal pronoun then to use the passive.

6) Avoid abusing word forms

Sunday, September 19, 2010

The Columbian Encounter and the Little Ice Age: Abrupt Land Use Change, Fire, and Greenhouse Forcing

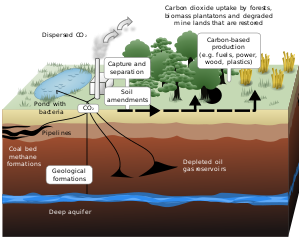
Schematic showing both terrestrial and geologi...Image via WikipediaThe Little Ice Age, a period of global cooling that occurred between 1500 and 1750, has been the subject of much scientific debate about what roles do people play in global climate change, and if natural variation has been the source of past warming and cooling periods.  The Little Ice Age has been previously attributed exclusively to natural variations through mechanisms like decrease in solar irradiance (the amount of sunlight which reaches the Earth), increase in global volcanic activity, and changes in ocean circulations.  The current article "The Columbian Encounter and the Little Ice Age: Abrupt Land Use Change, Fire, and Greenhouse Forcing" by Robert Dull and other leading researchers argue that anthropogenic causes played a larger role then once anticipated.  They conclude that the rapid population crash of indigenous people of the new world after the Columbian Encounter lead to a reforestation of the Neotropics creating a terrestrial biospheric carbon sequestration in the order of 2 to 5 billion tons.  A carbon sequestration event of this magnitude would be a significant forcing mechanism for global cooling during the Little Ice Age period.  Dull et al. reviewed fire history and reported high-resolution charcoal records to support the idea that the Neotropical lowlands went from being a net source of carbon dioxide to a net sink in the centuries following the Columbian encounters.   This article furthers the concept of anthropogenic forcing of climate before the Industral Revolution, and shows that people have a longer history on global climate change.

The Columbian Encounter and the Little Ice Age:Abrupt Land Use Change, Fire, and Greenhouse Forcing is avilable in the Annuals of the Assocation of American Geographers Special Issue on Climate Change October 2010


Dull, Robert A. , Nevle, Richard J. , Woods, William I. , Bird, Dennis K. , Avnery, Shiri and Denevan, William M.(2010) 'The Columbian Encounter and the Little Ice Age: Abrupt Land Use Change, Fire, and Greenhouse Forcing', Annals of the Association of American Geographers,, First published on: 01 September 2010 (iFirst)

http://dx.doi.org/10.1080/00045608.2010.502432

Robert A. Dull's UT Faculty Profile

Monday, March 22, 2010

How to Write Backwards - William E. Magnusson


William E. Magnusson
Bulletin of the Ecological Society of America, Vol. 77, No. 2 (Apr., 1996), p. 88
Published by: Ecological Society of America
Stable URL: http://www.jstor.org/stable/20168029
Quick Summary: Dr. Magnusson presents five simple rules useful for researchers taking on the task of writing.  These techniques are aimed at improving communication and clarity in writing scientific research.


Full Summary:
Through following Dr. Magnusson's five simple rules of writing, researchers should be able to avoid the "hopeless tangle of observation and inferences."
Rule 1: Write the conclusion of the paper. (Starting backwards) Each paper should have five or six substantial conclusions.  You should have an idea about these conclusions before starting.  While these conclusions will not be in your final paper, they should give you an idea of what direction you are taking with your paper.
Rule 2: Write only the reults necessary to make the conlustions.
Rule 3: Write the methods only need for the results.
Rule 4: Write the discussion that only deals with your conclusions. (e.g. Lit review that modifies, extends, contradicts or confirms the conclusions)
Rule 5: Write the introduction which has only the minimum information needed to present the question.
In conclusion the article shows a method that can be used to "edit" your paper.  Many reserach writers have a lot of big ideas buzzing in thier minds.  Lots of times we add in too much unneeded info which only distracts from our points.  By writing backwards you are focusing on the point that your are making and supporting it with results, then methods, then discussion, and finally a intro.  This method can lead to a clean paper that has meaningful in all it's part.
While writing backwards may not work for everyone, this article does make a point about the functionality of each part of you paper.  When you are writing an introduction it is done to present a question.  Many times people make the mistake of putting way to much information into an intro. Each part of a paper plays it own role to a final goal.  The final goal is to make some substantial conclusions.  Thinking about your paper in this way can lead to clear writing.
Just remember the ultimate goal of writing is to communicate.  Remember what you are trying to say.